NorthStar Realty, your trusted source for real estate information and investment success! Whether you're a seasoned investor or just dipping your toes into the world of property investment, our cutting-edge tools are designed to empower you with data-driven insights to make informed decisions. At NorthStar Realty, we utilize a powerful system for analyzing investment properties, incorporating key financial metrics and delivering a clear, visual chart of your investment’s performance over a 10-year period. Let’s dive into how our tools can help you unlock the full potential of your real estate investments.
By analyzing these metrics, our system helps you identify properties that align with your financial goals, whether you prioritize steady cash flow or long-term appreciation.
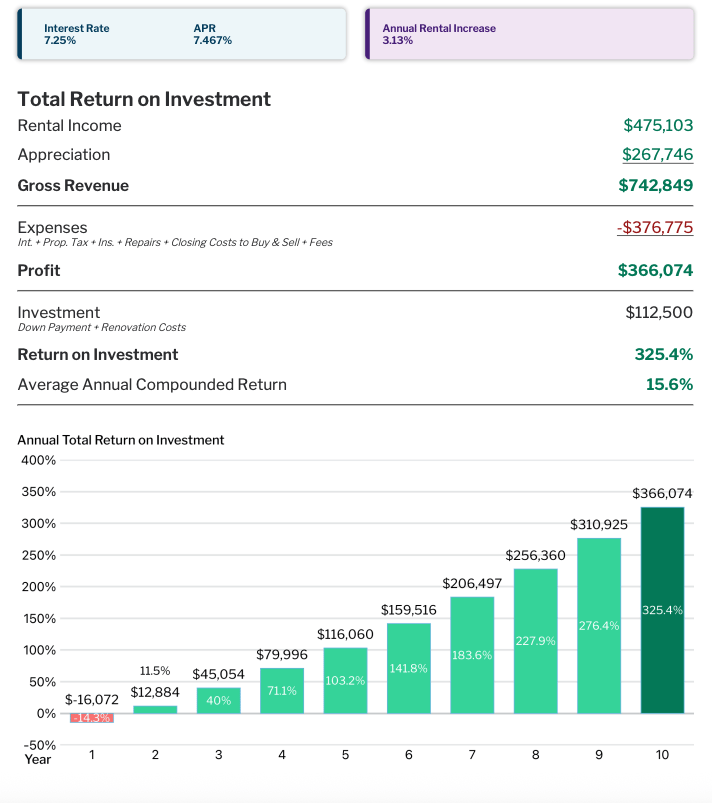
One of the standout features of NorthStar Realty’s system is our 10-year investment projection chart. This dynamic, user-friendly chart visualizes how your investment will perform over a decade, factoring in:
- Projected Cash Flow: See how rental income and expenses evolve over time.
- Appreciation Trends: Based on historical and local market data, we estimate property value growth.
- Loan Amortization: Understand how your mortgage payments reduce principal and interest over the 10 years.
- Tax Benefits: Account for potential deductions like depreciation and interest expenses.
The chart uses clear, color-coded visuals to highlight key trends, such as cash flow peaks, break-even points, and ROI milestones. Whether you’re presenting to partners or planning your portfolio, this visual tool makes complex data accessible and actionable.
How Our Tools Empower Investors
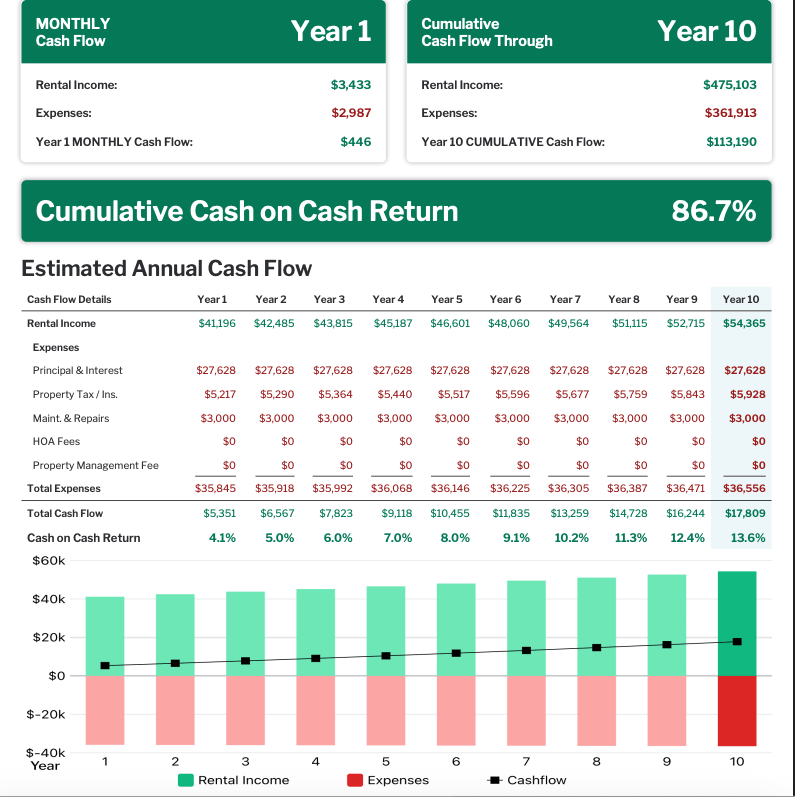
Imagine you’re evaluating a single-family rental property. You input the purchase price, estimated repairs, rental income, and financing details into our system. Within moments, our tools calculate key metrics like cap rate, NOI, and ROI, while factoring in local market trends. The 10-year projection chart then shows you:
- Year 1: Positive cash flow after expenses and mortgage payments.
- Year 5: Break-even point on initial investment due to appreciation and rental income.
- Year 10: Projected ROI, including property value growth and cumulative cash flow.
This visual roadmap helps you decide whether the property aligns with your goals or if you should explore other opportunities. Our clients, from first-time investors to seasoned professionals, have used these insights to close deals faster and build profitable portfolios.
Connect with one of our agents for your custom property analysis today!
NorthStar Realty: Your Source for Real Estate Information and Investment Success. Start analyzing your next investment property today and see where a decade of smart decisions can take you!